Two projects big enough to talk about. One draws the hidden structure behind public statistics; the other drops a rocket through weather onto a moving barge. Both are built the same way — I own the design calls, the rules and the physics, and I direct AI to write the code against them.
The Economic Report Influence Graph
Every important number in public life — inflation, a disability payment, how much your city gets for road repair — is calculated from some other number, which was calculated from another, back to a handful of foundational statistical releases. Almost nobody can see that structure, including the people who depend on it.
This draws it. Each sphere is a real published report, each line a documented dependency between two of them, and a report’s size is how much everything else rests on it. It runs in a browser, in 3D, with no backend: 3,632 reports and 3,272 dependencies across more than a hundred countries, from Statistics Canada down to individual municipal budgets.
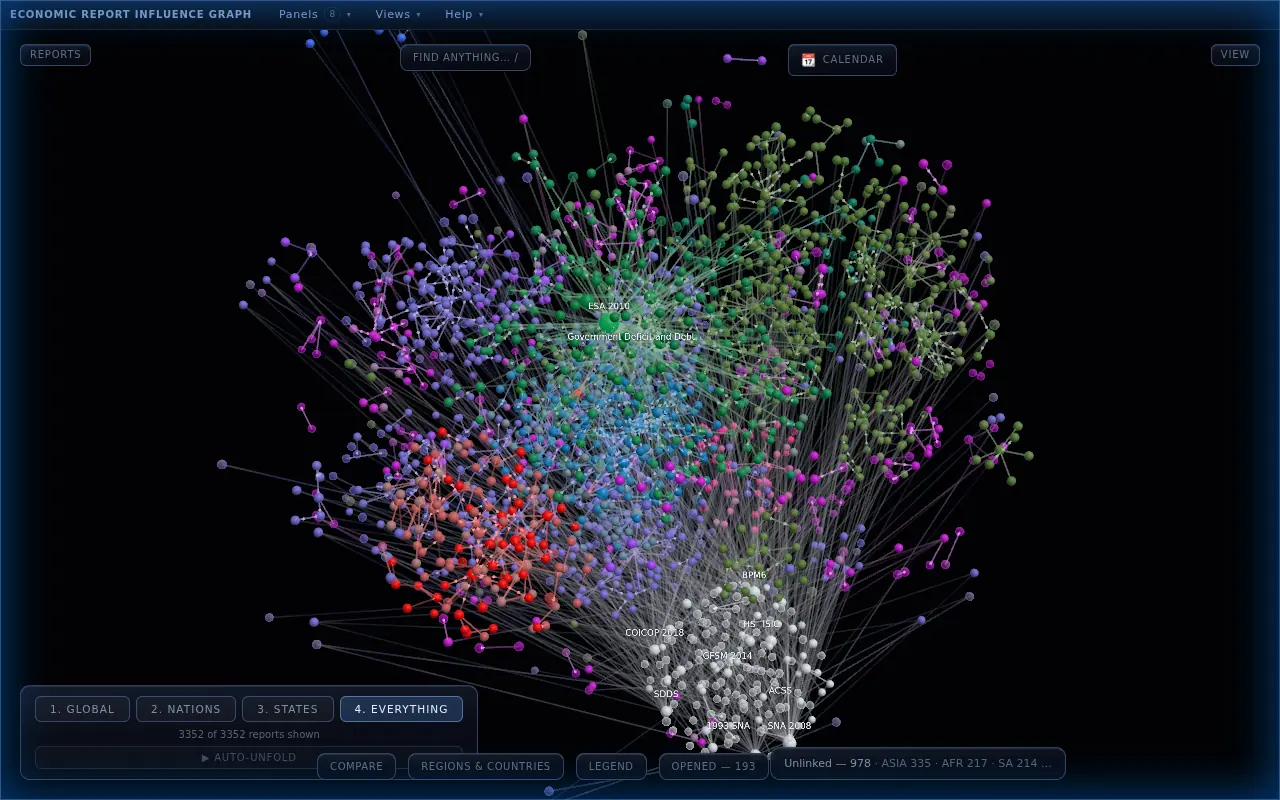
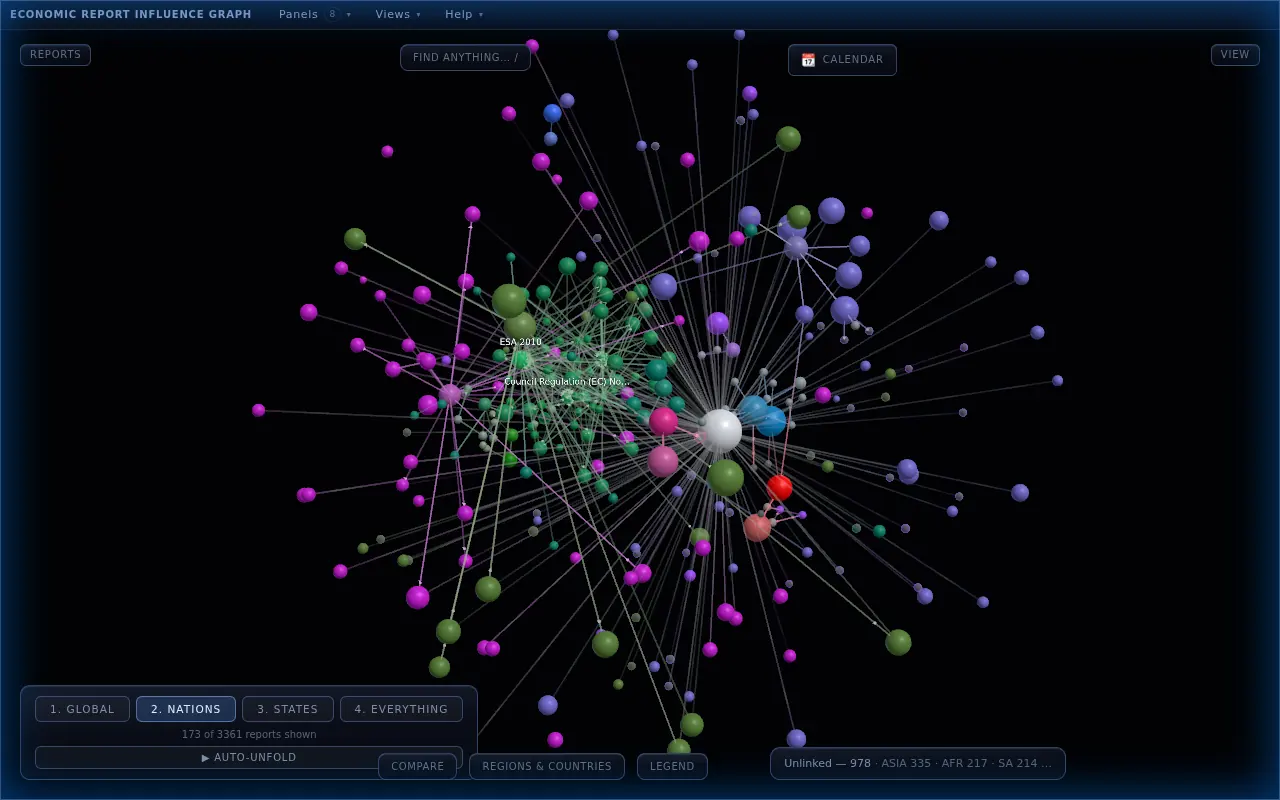
Open the graph Runs in the browser. Give it a moment on a phone.
The one rule the whole project runs on
No document, no edge. A line only gets drawn if a published document says, in words I can quote, that one report uses the other as an input. Leads I cannot source go to a dropped list with a reason attached, not into the graph. Every existing line has since been graded on how well its cited document actually supports it — 1,256 A, 1,404 B, 612 C — and the grade is visible in the app, because a map that hides its own weak spots is worse than no map.
What is actually hard about it
Not the 3D. The hard part is holding one standard across eighty-odd research sessions without drift, which is why the repository carries a fixed extraction protocol, two lane playbooks and exactly one handoff file rather than a pile of notes — and why a validator runs on every data change and refuses to pass on a dangling reference.
The other hard part is drawing 3,600 nodes without lying. Cluster spacing, node size scaling and camera framing all change what a viewer believes about the data, so each one gets measured rather than eyeballed — including a repulsion force I shipped, retested against a clean rig, and had to rebuild when the first calibration turned out to be measuring its own bug.
- Corpus
- 3,632 reports · 3,272 documented dependencies
- Evidence grades
- 1,256 A · 1,404 B · 612 C — 38.4% A-share
- Coverage
- 130+ countries; national, state, municipal and institutional tiers
- Code
- ~24,700 lines of TypeScript across 50 source files
- Stack
- Vite · React · three-forcegraph · d3-force-3d · no backend
Rocket Lander
Land a rocket, gently, with the fuel you were given. It falls belly-down through layered, gusting wind, flips, burns, and has to sit down on a droneship that is bobbing on swell and drifting away from you. A run lasts twenty to sixty seconds. Failure is instant and obviously your own fault.
The teaching idea came first: I want the tuning knobs to be the interface, so a nine-to-twelve-year-old learns the physics by flying against it rather than reading about it. There are 38 knobs behind one key — gravity, thrust, gimbal authority, drag, wind, fuel, pad tolerances — and the panel builds itself from a spec table, so adding a knob is one variable and one row.
Three things the build taught me
Thrust from the tail does nothing on its own. I asked for the engine to push from the back, expecting it to matter. A nozzle pointing down the body axis pushes straight through the centre of mass and produces no torque — which is exactly why a real rocket’s engine being at the bottom does not tip it over. Gimballing the nozzle is what makes it steer.
Drag had to be split in two. Along-hull and across-hull flow are dragged separately, and across is about twelve times along. That split is the entire reason the belly-flop is worth doing: because the two components do not sum to a force pointing straight back along the airflow, tilting off broadside produces lift, and that glide is the only way to reach a barge that is not directly beneath you.
A restoring force without a damper is a pendulum. The weathervane moment that settles the ship belly-down is a spring; with no aerodynamic rotational damper against it, the ship swings forever. Easy to forget, extremely obvious the moment it is missing.
Where it is
It flies. Landing it is brutally hard — which is the direction, not the bug: I am after real physics and real logic, difficult but winnable, the way the actual thing is difficult but winnable. What is left is tuning and time. It is parked until the influence graph is more or less finished and keeping itself up to date.
- Engine
- Godot 4.7.1 · GDScript · Jolt physics
- Flight model
- Gimballed thrust, weak RCS, four hinged flaps, finite fuel
- Weather
- Density falling with altitude; wandering wind layers, three out-of-phase gusts
- Tuning
- 38 live knobs, spec-driven panel, presets saved to disk
- Target player
- Ages 9–12 — one new variable introduced per level
- Status
- Flight model and weather built · tuning by feel is next
How these get made
I am not a trained programmer. I spent seventeen years running kitchens, and what transferred was the useful half: deciding what “good” means, writing the standard down, and holding every plate that leaves to it. The code is written with AI; the specification, the evidence rules, the physics and the judgement about what ships are mine — and so are the parts that are wrong.